Machine-Learning-Project
Predicting Students Academic Success
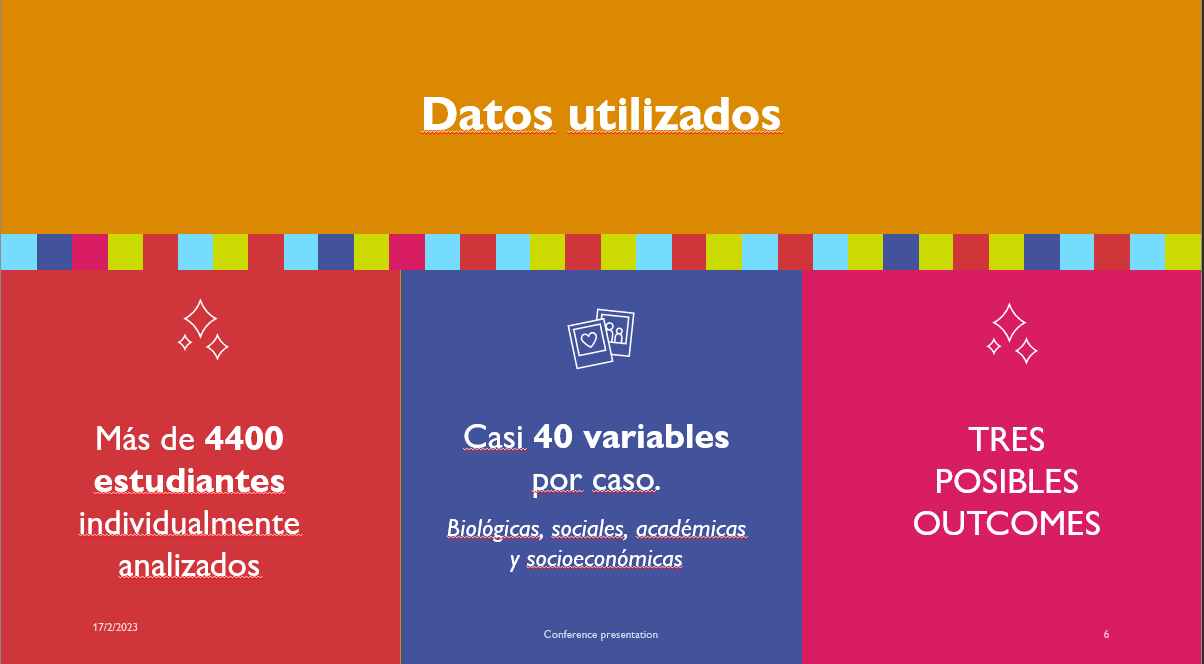
This project aims to predict the academic success of students in the USA using a dataset with more than 4000 rows and 30 features. The target variable is to predict if the student will graduate, dropout or enroll. The project is based on a Jupyter Notebook and uses various Python libraries for data analysis, processing, and modeling like Pandas, Numpy, Seaborn, Matplotlib and Sklearn

Table of Contents
- Problem Explanation
- Dataset
- Data Analysis
- Data Processing
- Data Modeling
- Predictions and Future Steps
Problem Explanation
The educational institutions in the USA face a big challenge in predicting the academic success of students. By predicting if the student will graduate, dropout or enroll, the institutions can take preventive measures to avoid dropouts, help struggling students and increase their success rate. The goal of this project is to build a predictive model that can help educational institutions identify at-risk students and provide them with the necessary support.
Dataset
The dataset used in this project is a publicly available dataset on Kaggle with more than 4000 rows and 30 features. The dataset includes information about the student’s background, their academic performance, and various demographic factors. The target variable is to predict if the student will graduate, dropout or enroll. The data can be found in the data directory.

Data Analysis
Before building a predictive model, it’s important to analyze the data and understand its patterns and relationships. The data analysis section of the Jupyter Notebook includes exploratory data analysis, descriptive statistics, and data visualization to gain insights into the data.
Data Processing
After the data analysis, the next step is to preprocess the data for modeling. The data processing section of the Jupyter Notebook includes data cleaning, feature engineering, and feature selection. The goal of this step is to transform the data into a format that can be used by the machine learning models.
Data Modeling
With the preprocessed data, the next step is to build a predictive model. The data modeling section of the Jupyter Notebook includes building and training various machine learning models to predict if the student will graduate, dropout or enroll. The models are evaluated based on various performance metrics to select the best model for the task.

Predictions and Future Steps
After building a predictive model, the next step is to make predictions on new data. The predictions section of the Jupyter Notebook includes making predictions on a test dataset and evaluating the performance of the model. Finally, the future steps section includes suggestions for future work, such as improving the model performance, using different modeling techniques, and expanding the dataset.
Thank you for taking the time to check out this project! If you have any questions or comments, feel free to contact us.